Chapter 7: Week 3, Session C — Copilot in Excel
Data Analysis, Visualization, and the Death of the Manual Pivot Table
1Chapter 7: Week 3, Session C — Copilot in Excel
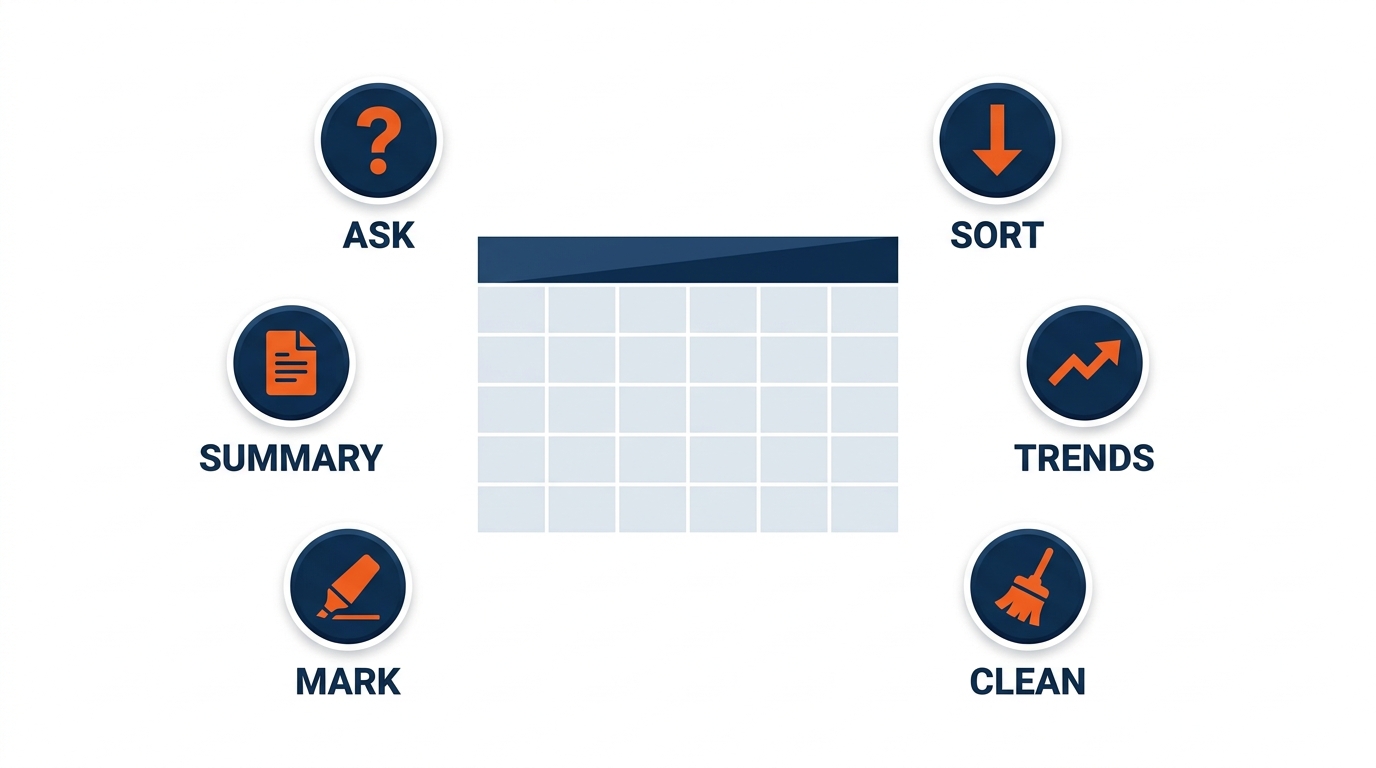
Figure 1:Copilot in Excel’s confirmed capability pillars — each one eliminating a category of mechanical analytical work that has consumed show operations, logistics, and finance professionals’ time for decades. The shift is not from human to machine. It is from mechanical execution to professional judgment.
“The goal is to turn data into information, and information into insight.” — Carly Fiorina
Here is a question worth sitting with for a moment.
How much of your last week was spent thinking about data — drawing real conclusions from it, making decisions based on it, seeing patterns that changed how you understand a show — versus wrestling with data? Fighting with formulas. Manually formatting columns. Rebuilding a post-show reconciliation Pivot Table that took 45 minutes and had to be redone when the final labor file landed. Searching for which row in the freight manifest had the inconsistent date format that broke the entire import.
For most GES professionals, the honest answer is uncomfortable. A disproportionate share of what we call “analysis” is actually data wrangling — the mechanical, unglamorous labor that precedes the thinking. The thinking is what we were hired for. The wrangling is what we do instead.
That ratio is about to change.
Copilot in Excel does not make you a better data wrangler. It makes data wrangling significantly faster and less painful. What used to take hours — building the right formula, cleaning an inconsistent warehouse receiving export, creating a chart, surfacing the outliers in a drayage dataset — now takes minutes, and often seconds. The ceiling of what you can ask of your data, without being a data scientist, rises dramatically.
This matters more at GES than it would at most companies, and the reason is scale. GES runs 4,000+ live experiences a year, serves 150,000+ exhibitors, operates in 75+ countries, and moves freight through 24 global production and warehouse facilities. Every one of those shows generates data: a freight manifest, a labor call sheet, a material handling report, an exhibitor order file, a housing pickup report, an emissions log. Multiply a 45-minute reconciliation by 4,000 shows and you are looking at an ocean of mechanical work that no amount of headcount will ever fully drain. This is exactly the kind of problem where a small per-task saving compounds into something structural.
This chapter covers every confirmed Copilot-in-Excel capability, grounded in what Microsoft’s official documentation actually supports today. We will also be direct about the limits — what Copilot cannot reliably do and why that matters in an environment where a miscalculated drayage estimate or a mis-forecast labor call becomes a real invoice, a real margin hit, and a real conversation with a show organizer. By the end, you will know how to use these tools effectively and how to use them safely.
Every concept lands on a GES example — drayage cost per hundredweight, freight target versus actual, I&D crew hours against forecast, exhibitor attach rate, onPeak room block pickup, cost per square foot by venue — because that is the data you work with.
1.11. The Foundation — Setting Your Data Up Correctly
Before a single Copilot feature will work in Excel, one thing must be true: your data must be formatted as a table.
This is not a minor technical footnote. It is the architectural requirement that makes everything else in this chapter possible. If you send this chapter to your desk drawer after reading it, take one thing with you: format your data as Excel tables.
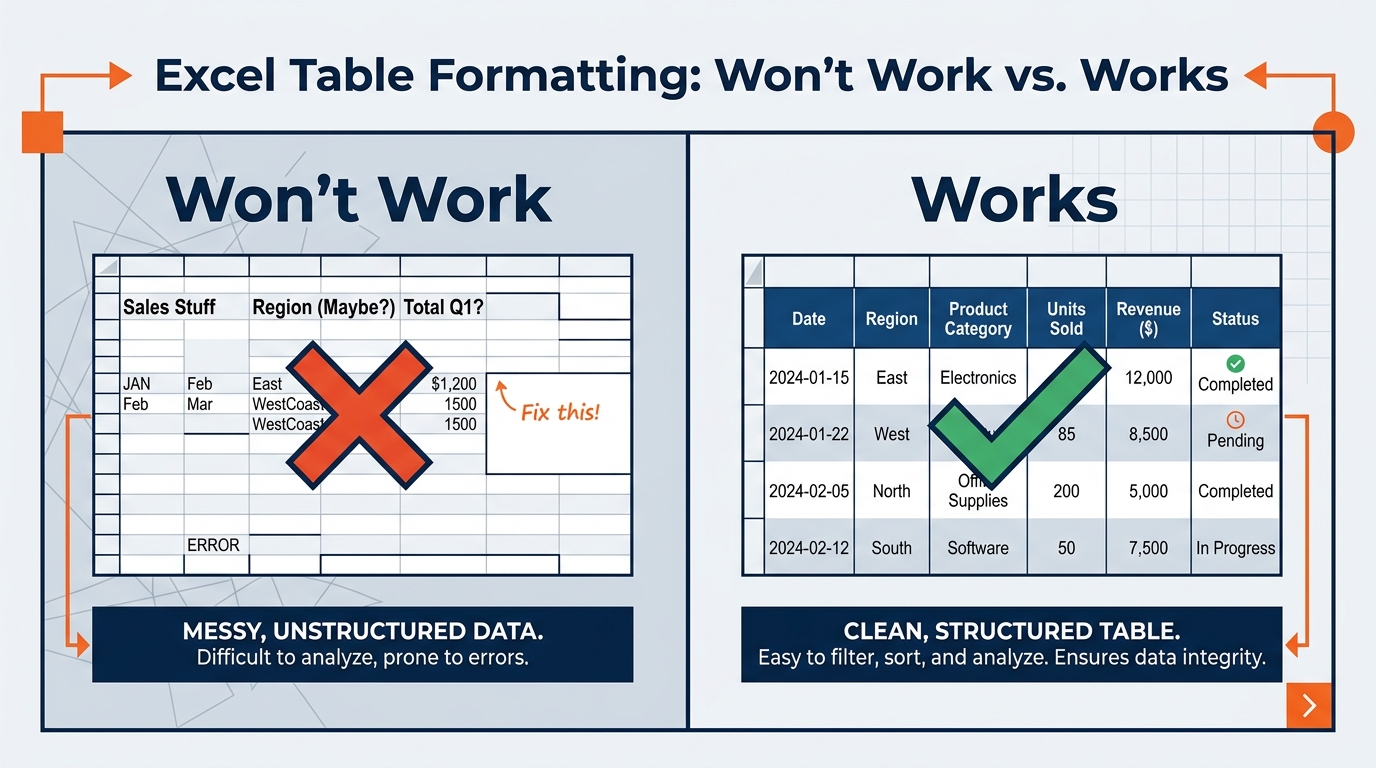
Figure 2:The table format requirement is the foundation that unlocks every Copilot capability in Excel. Without it, Copilot cannot read your data. With it, every feature in this chapter becomes available.
Why tables are required:
Copilot in Excel works by reading the structure of your data — understanding which columns contain what kind of information, where the headers are, where the data begins and ends. An Excel table provides exactly that structure in a form Copilot can interpret. A plain range of cells — even one that looks like a table — does not give Copilot the structural information it needs.
This is worth internalizing because most operational data at GES does not arrive as a table. A material handling report exported from a warehouse system arrives as a flat range. A labor call sheet emailed by a general foreman arrives as a formatted block with merged title cells across the top. An exhibitor order extract arrives with three header rows and a blank spacer. Each of those needs 30 seconds of cleanup before Copilot can do anything with it. Thirty seconds is cheap. Not knowing you need to spend it is expensive.
How to format data as a table:
Click anywhere inside your data range.
Press Ctrl + T (Windows) or ⌘ + T (Mac). Or go to Insert → Table.
Confirm that the “My table has headers” checkbox is checked.
Click OK.
Your data is now an Excel table. The Copilot button in the Home tab ribbon will activate immediately.
Where Copilot can read your files:
Copilot in Excel works with files stored in OneDrive or SharePoint — the cloud-connected Microsoft 365 file locations. If you are working from a file saved locally on your device, Copilot functionality requires that file to be synced to OneDrive. The simplest approach: always save your working Excel files to your OneDrive for Business, and Copilot will have full access.
For show teams this has a practical implication that is easy to miss. If you are on the floor in Las Vegas, Orlando, ExCeL London, or Dubai World Trade Centre working from a file you copied to your laptop desktop during move-in, Copilot cannot see it. Save show files to the show’s SharePoint library — which you should be doing anyway so the pre-show team, the on-site crew, and the post-show reconciliation analyst are all working from one version.
Column headers matter more than you think:
Copilot uses your column headers to understand what the data means. A column labeled “Wt” is harder for Copilot to interpret correctly than one labeled “Inbound Weight (lbs).” A column labeled “Hrs” is ambiguous — is that straight time, overtime, or total? “I&D Straight Time Hours” is not ambiguous. A column labeled “MH” could mean material handling, man-hours, or move-in hours depending on who built the sheet; “Material Handling Charge (USD)” removes the guesswork.
This is a genuinely GES-specific problem. Our operational vocabulary is dense with abbreviations that are perfectly clear to a show operations manager and completely opaque to a language model: GSC, EAC, I&D, CWT, MHA, OT, DT, MIMO. Copilot has no institutional memory. Spell it out in the header. Invest two minutes in naming your columns clearly — it pays dividends in every Copilot interaction that follows, and it makes the file readable to the next person who inherits it, which is the more durable benefit.
Table 1:Column Header Rewrites That Improve Copilot Accuracy
Common GES Export Header | Rewrite As | Why It Helps |
|---|---|---|
|
| Distinguishes inbound from outbound; states the unit |
|
| Expands the industry abbreviation Copilot does not know |
|
| Separates straight time from overtime and double time |
|
| “Rate” alone could be freight, labor, or margin |
|
| Net versus gross square footage is a real distinction |
|
| onPeak housing data is unreadable without this |
|
| Splitting the identifier from the label enables clean grouping |
|
| Two facts crammed into one column header |
1.22. Formula Generation and Explanation — The End of the Syntax Search Loop
Let’s start with the capability that will save you the most accumulated time in the shortest period.
Every Excel user has experienced this: you know what calculation you need. You know roughly which function would do it. But the exact syntax — the argument order, the data type requirements, the nested logic — is just out of reach. So you open a browser tab, search “Excel XLOOKUP syntax,” read through three different explanations, come back, try it, get a #REF! error, go back to the browser, try again.
That loop is over.
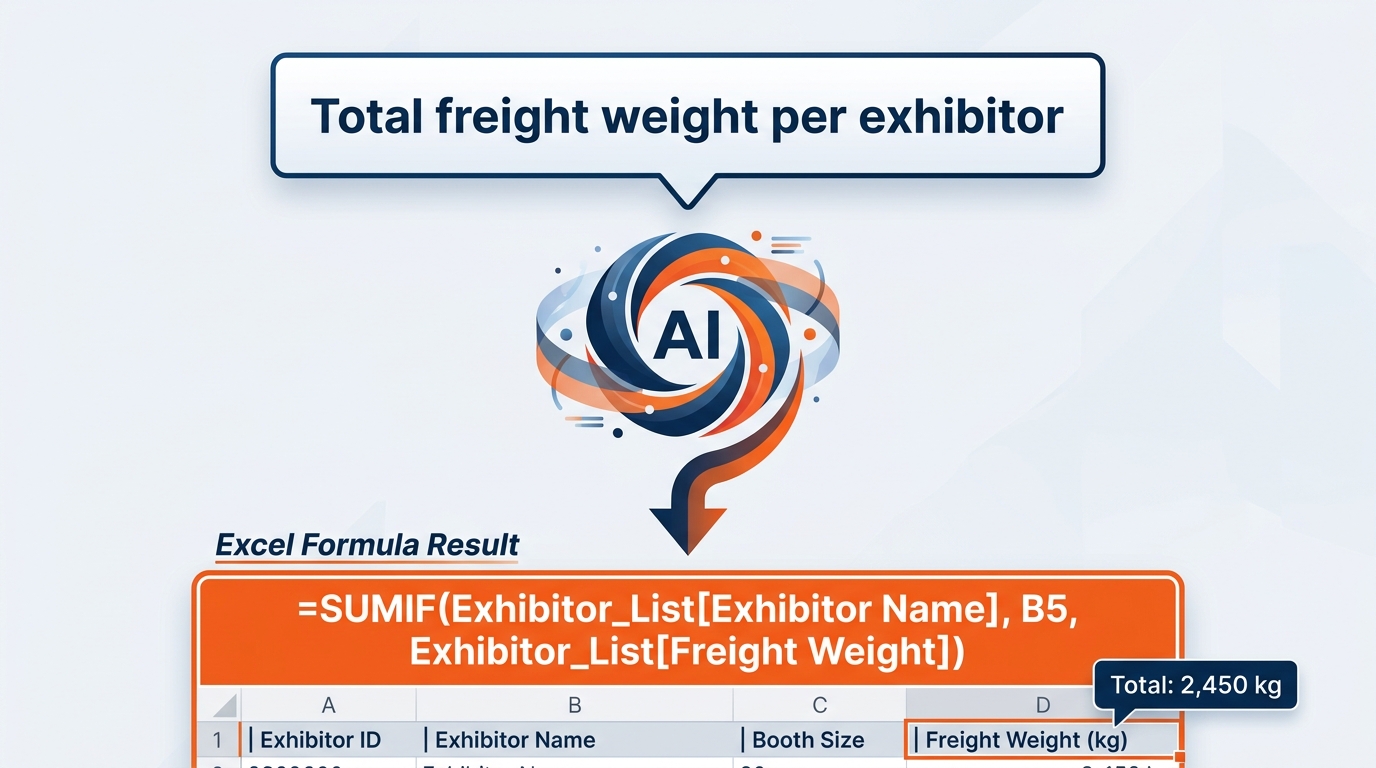
Figure 3:The formula syntax search loop was never valuable work. It was a tax on knowing what you want but not knowing the exact language to express it. Copilot eliminates that tax — and then explains what it built, so you understand what is in your workbook.
How formula generation works:
Open your Excel workbook (in OneDrive or SharePoint, formatted as a table). Click the Copilot button in the Home tab ribbon. The Copilot pane opens on the right side of your screen. Describe the calculation you want in plain English:
“In a new column, calculate the variance between our freight target and the actual freight cost for each show. The target is in the ‘Freight Target (USD)’ column and the actual is in ‘Freight Actual (USD)’. Show it as a percentage of target.”
Copilot reads your table structure, understands the columns you referenced, and generates the formula:
=(([@[Freight Actual (USD)]]-[@[Freight Target (USD)]])/[@[Freight Target (USD)]])*100Along with the formula, Copilot provides an explanation — in plain English — of what the formula does:
“This formula calculates the percentage by which actual freight cost differed from the freight target. A positive result means the show came in over target; a negative result means it came in under. The result is expressed as a percentage of the target amount.”
Copilot then offers to add this formula as a new column in your table. You click “Insert Column” and it is done.
The dual value of formula explanation:
Formula generation has an equally valuable counterpart: formula explanation. Click on any existing formula in your workbook — including one you inherited, one built by a former colleague, or one in a reconciliation model that has been passed between three account teams since 2019 — and ask Copilot: “Explain what this formula does.”
Copilot reads the formula and explains it in plain English. No more decoding nested IF statements at 6am on move-in day. No more inheriting a show P&L model and spending half a day figuring out what it is actually calculating and why the margin line does not tie to the invoice summary. The explanation feature alone is worth hours of time to every GES professional who has inherited a complex spreadsheet model — which is essentially everyone in operations, logistics, and finance.
The GES formulas where this matters most:
The modern replacement for VLOOKUP — more powerful, fewer limitations, but with a syntax that trips up even experienced Excel users. Example prompt: “Look up each show’s venue and union jurisdiction from the Venue Reference table on Sheet2, matching on Show Code.” Copilot handles the exact/approximate match setting, the if-not-found argument, and the column direction automatically. This is the single most common lookup in show analytics — every operational file needs venue, jurisdiction, and facility attributes joined onto it.
Multi-condition aggregation — the bread and butter of post-show reconciliation. Example: “Sum the values in the ‘Material Handling Charge (USD)’ column where the ‘Show Code’ column matches ‘MINEX-26’ AND the ‘Shipment Type’ column is ‘Advance Warehouse’.” This one query separates advance warehouse receiving from direct-to-show floor deliveries, which is the split that drives half of every drayage conversation you will ever have.
The formulas that are readable at 9am and incomprehensible when debugging at 4pm on the last day of move-out. Example: “Create a ‘Labor Variance Flag’ column that shows ‘Critical’ if actual I&D hours exceed forecast by more than 25 percent, ‘Review’ if they exceed forecast by 10 to 25 percent, ‘On Plan’ if within plus or minus 10 percent, and ‘Under’ if actual hours are more than 10 percent below forecast.”
Move-in and move-out windows, target ship dates, advance warehouse deadlines. Example: “Calculate the number of calendar days between the ‘Advance Warehouse Receipt Date’ column and the ‘Show Move-In Date’ column. Then add a ‘Deadline Flag’ column that marks anything received fewer than 3 days before move-in as ‘Late Receipt’.” Late advance warehouse receipts are a leading indicator of on-site chaos; this is a genuinely useful early-warning column.
Standard deviation, percentile ranking, trailing averages. Example: “Add a column showing the rolling three-show average of ‘Material Handling Revenue per Exhibitor’ for each venue.” Rolling averages smooth out the distortion caused by one anomalous show and make show-over-show comparison meaningful.
The conversions that fill every freight file. Example: “Add a column that converts ‘Inbound Weight (lbs)’ into hundredweight by dividing by 100, then a second column that multiplies hundredweight by ‘Material Handling Rate per 100 lbs (USD)’ to produce an estimated material handling charge, with a 200-pound minimum applied.” Note the minimum — a real tariff rule that Copilot will honor only if you tell it.
The 9th Grader Test:
Think of it this way. You speak fluent English. Excel speaks fluent Formula. For 30 years, you had to learn Formula — with its exact argument order, its parenthesis matching, its cryptic error codes — to tell Excel what you wanted. Copilot is the interpreter standing between you and the Formula language. You speak English. Copilot hears you, translates to Formula, hands it back with a receipt (the explanation) so you can verify it got the translation right, and then applies it.
The interpreter does not replace your judgment about what to calculate. It removes the barrier between your judgment and Excel’s execution.
The analogy is imperfect in one important way: unlike a human interpreter, Copilot can occasionally make a mistranslation — generating a formula that looks right but has a subtle logical error. The control for this is the same as it has always been: read the explanation, spot-check the output on several known rows before accepting it for the full dataset, and never let an AI-generated formula reach an exhibitor invoice, an organizer settlement, or a show P&L without verification.
The revolution in your day:
Operational and financial analysts spend an estimated 3–5 hours per week in the formula search loop. At the show operations manager and account manager level, it is less frequent but more costly per instance — because the calculations are more complex, and the stakes of error are higher when the output is going into a settlement conversation with an organizer. Eliminating that friction does not just save time. It changes which analyses you are willing to attempt. If building the right formula costs 90 minutes, you run only the analyses worth 90 minutes of setup. If it costs 90 seconds, you run every analysis worth asking.
That is the real unlock. Nobody was ever going to build a cost-per-square-foot comparison across 14 venues by hand for a Tuesday planning meeting. Now somebody will.
1.33. Natural-Language Data Exploration — Asking Questions, Getting Answers
This is the capability that most changes the nature of your relationship with data.
Excel has always been a tool that answered questions you already knew how to ask in Formula. Copilot makes it a tool that answers questions you know how to ask in English. The difference is enormous for professionals who have deep operational knowledge but limited programming fluency — which describes most of the people who actually run shows.
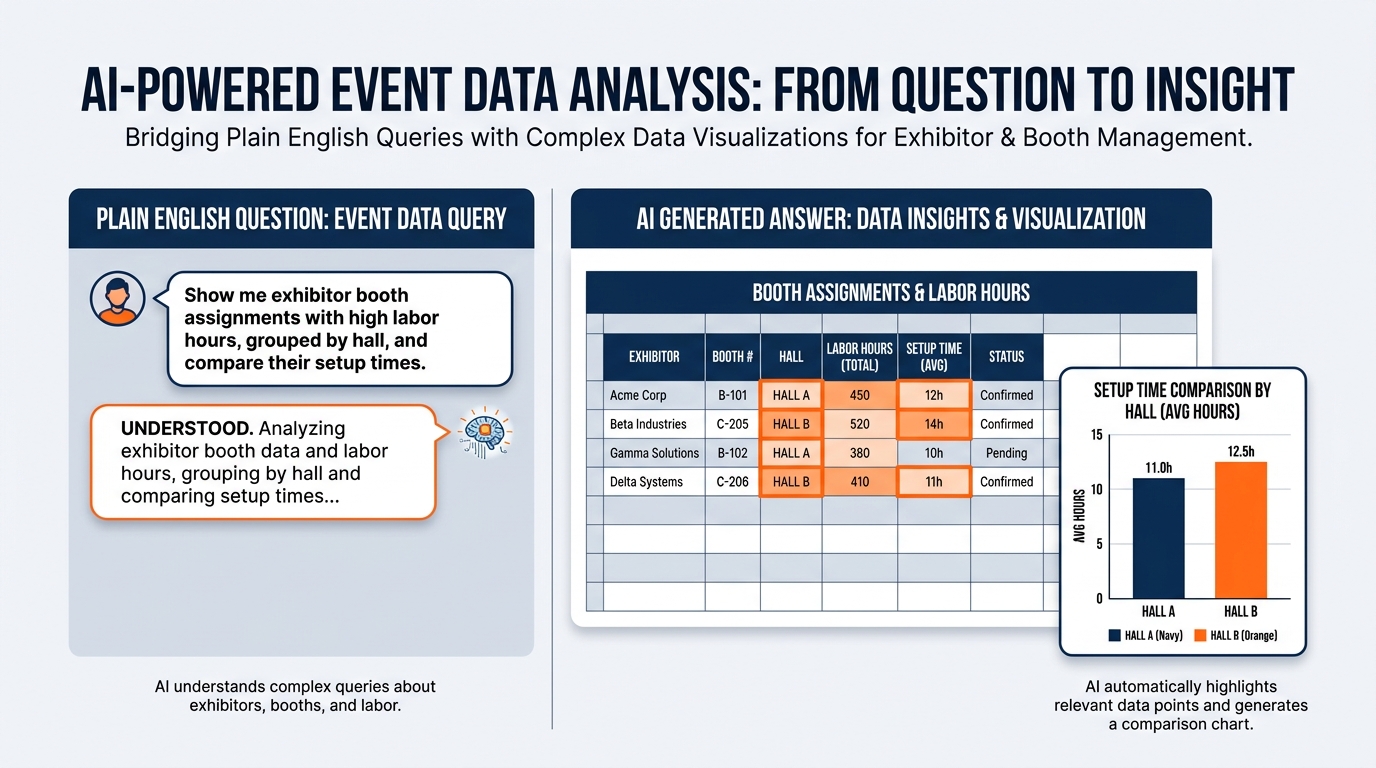
Figure 4:Natural-language data exploration collapses the distance between “I want to understand this” and “I understand this.” Ask a question. Receive a chart, a Pivot Table, or a summary — whichever format best answers it.
How it works:
With your data formatted as an Excel table and your file in OneDrive or SharePoint, open the Copilot pane and type your question — not a formula request, but an actual business question:
“Which shows had the highest material handling revenue per exhibitor over the last four quarters?”
Copilot analyzes your table, runs the relevant calculations, and responds with one of several output types — whichever is most appropriate to the question:
A chart — a visual rendering of the answer (bar chart, line chart, pie chart, etc.)
A Pivot Table — an interactive summary table you can continue to filter and explore
A text summary — a written synthesis of the finding with key numbers highlighted
A highlighted range — specific cells in your table called out for attention
You can also ask Copilot to generate a specific output type: “Show me this as a bar chart” or “Give me a Pivot Table grouped by venue and by show.”
The chart generation workflow:
Natural-language chart requests are one of the most practically useful Copilot-in-Excel features for GES professionals. The old process — select range, insert chart, configure type, fix axes, fix labels, resize, format — took 15–30 minutes for a non-trivial chart. The new process is a sentence:
“Create a bar chart showing total material handling charges by show for the last six months, sorted highest to lowest.”
Copilot determines the appropriate chart type, maps your data columns to the correct axes, applies labels, and inserts the chart into your workbook. The chart is a standard Excel chart — fully editable, formatted however you need, exportable to PowerPoint with one click. That last property matters enormously when the same numbers have to appear in a post-show recap deck for the organizer 48 hours after move-out.
GES data exploration prompts that unlock the most value:
“Show me total material handling charges by show, split between advance warehouse and direct-to-show-floor shipments.”
“Create a Pivot Table showing average material handling charge per hundredweight, grouped by venue and by shipment type.”
“Which shows have the highest ratio of material handling revenue to total exhibitor square footage? Rank them.”
“Give me a line chart of monthly advance warehouse receiving volume in pounds over the past 18 months.”
“How much of our inbound tonnage arrived within three days of move-in? Show it as a percentage by show.”
“Show me freight actual versus freight target by show as a clustered bar chart.”
“Which shows exceeded their freight target by more than 15 percent? List them with the dollar variance.”
“Create a Pivot Table of freight variance grouped by venue and by quarter.”
“Is there a relationship between show size in net square feet and freight variance percentage? Show me a scatter plot.”
“What is our aggregate freight variance year to date, and which three shows contributed the most to it?”
“Compare forecast I&D crew hours to actual crew hours by show. Show me the ten largest overages.”
“Create a Pivot Table showing straight time, overtime, and double time hours by union jurisdiction.”
“What percentage of total labor hours were overtime, by show? Give me a sorted bar chart.”
“Which venues have the highest average overtime percentage during move-in versus move-out?”
“Show me a line chart of total I&D labor cost per net square foot by show over the past year.”
“Create a Pivot Table showing revenue, direct cost, and gross margin by show for the last two quarters.”
“Which shows had a final reconciled margin more than 5 points below the pre-show estimate? List them.”
“Show me a waterfall-style breakdown of what drove the margin gap on the three lowest-margin shows.”
“Summarize total billed revenue by service line — material handling, labor, furnishings, carpet, electrical, signage.”
“What is our service attach rate — the percentage of exhibitors who ordered at least one GES service — by show?”
“Show me average service revenue per exhibitor by show, as a bar chart sorted descending.”
“Which shows have an attach rate above 70 percent but below-average revenue per exhibitor? List them.”
“Create a Pivot Table of exhibitor order volume by service category and by show.”
“Compare this year’s revenue to last year’s for every show that ran in both years. Show the percentage change.”
“Show me room block pickup percentage by show and by hotel as a Pivot Table.”
“Which hotel blocks are below 60 percent pickup with fewer than 30 days to the attrition deadline? Flag them.”
“Create a line chart of cumulative room nights booked by week for the last four shows, overlaid.”
“What is our total attrition exposure in dollars across all active blocks?”
“Which shows show a consistent pattern of late booking surges in the final two weeks?”
“Show me total net booth square footage by show and the resulting aisle carpet consumption in square yards.”
“What is our cost per net square foot by venue? Give me a ranked bar chart.”
“Which venues have the highest aisle carpet consumption relative to total show floor area?”
“Compare carpet ordered versus carpet installed by show. Flag any variance above 8 percent.”
“Show me total reported emissions by show, normalized per net square foot.”
“Which shows had the highest reuse rate on structural stand components? Rank them.”
“Create a Pivot Table of waste diverted from landfill by venue and by show.”
“Show me a trend line of emissions per exhibitor across the last eight shows at the same venue.”
The key insight:
Natural-language data exploration is not about replacing analytical thinking. It is about removing the mechanical execution barrier between a business question and a data-driven answer. The business question — the right question — still requires a professional who understands how a show actually runs: why move-in at one venue burns more overtime than at another, why an exhibitor base skews toward heavy crated freight, why one organizer’s floor plan generates more aisle carpet than another’s at identical square footage. Copilot handles the “now let me go build the Pivot Table to answer that” step. You own the “which question is worth asking” step — which is the more valuable one, and the one that eighty-plus years of operating experience since 1939 actually bought us.
1.44. Highlighting, Sorting, and Filtering — Copilot as Your Data Navigator
Before we go deeper into analytical capabilities, it is worth spending a moment on a category of Copilot-in-Excel features that are less dramatic but perhaps the most immediately practical: directing Copilot to highlight, sort, and filter your data on your behalf.
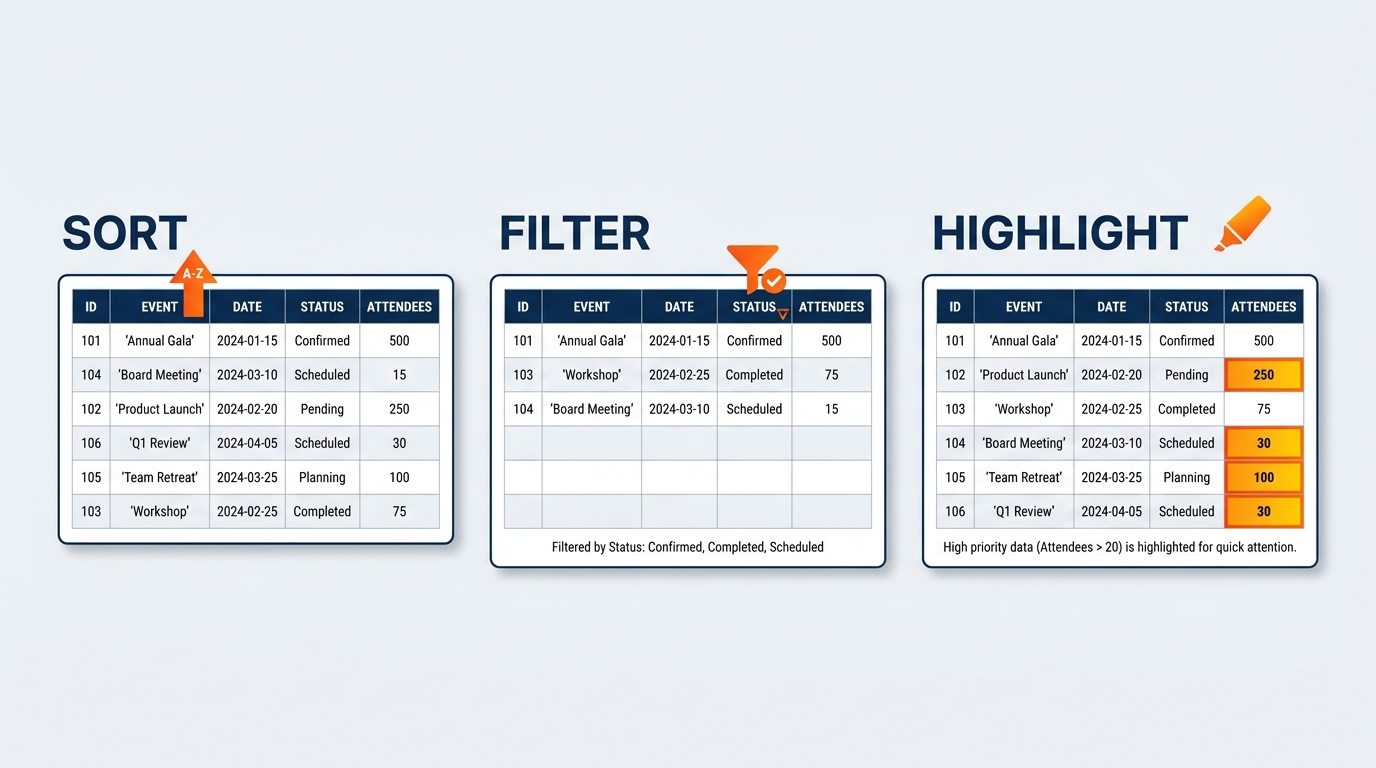
Figure 5:Highlighting, sorting, and filtering with natural language — the navigational capabilities that make Copilot feel like a data assistant sitting beside you, rather than a tool you have to configure.
What this looks like in practice:
“Highlight the cells in the Freight Variance column where the value is above 10 percent.” Copilot applies conditional formatting to those cells — red fill, or whatever you specify — so the shows that blew their freight target are immediately visible without you building a conditional formatting rule manually.
“Sort this table by total material handling revenue from highest to lowest.” Copilot applies the sort. One sentence, done.
“Filter the table to show only shows where actual I&D hours exceeded forecast hours.” Copilot applies the filter. You see only the shows of interest.
“Show me only the rows where the shipment type is ‘Advance Warehouse’ and the inbound weight is above 5,000 pounds.” Multi-condition filter. Applied instantly.
“Highlight every hotel block where pickup is below 55 percent and the attrition date is within 21 days.” The onPeak housing analyst’s entire Monday morning, in one sentence.
Why this matters in a show environment:
The value of these capabilities is in their speed and their repeatability. A weekly show pipeline review might involve the same sequence of sorts, filters, and highlights every single time — and each one, done manually, takes a minute or two of clicking and configuring. The Copilot workflow compresses that sequence dramatically and, importantly, keeps your hands off the mouse and your eyes on the data.
It also matters because a lot of this work happens in bad conditions. You are in a show office with a folding table and a laptop, it is loud, the forklift traffic outside has not stopped since 6am, and you have eleven minutes before the organizer walkthrough. Typing one sentence beats navigating four menus. This is one of the few software features that is genuinely better under stress.
There is also a less obvious benefit: these operations are fully reversible and leave no permanent changes to your underlying data. Copilot’s sorts and filters work through Excel’s native sort and filter mechanisms — which means clearing them and returning to the full dataset is a single click.
1.55. Trend Identification and Outlier Detection — The Analytical Questions That Previously Required an Analyst
Here is where Copilot in Excel makes its most significant leap from tool to analyst.
The features above — formula generation, chart creation, sorting and filtering — are force multipliers on tasks that GES professionals already knew how to do. This section is different. This is about the questions you never asked your data before, because asking them required either a dedicated analyst or far more manual work than most professionals could justify between move-out on one show and move-in on the next.
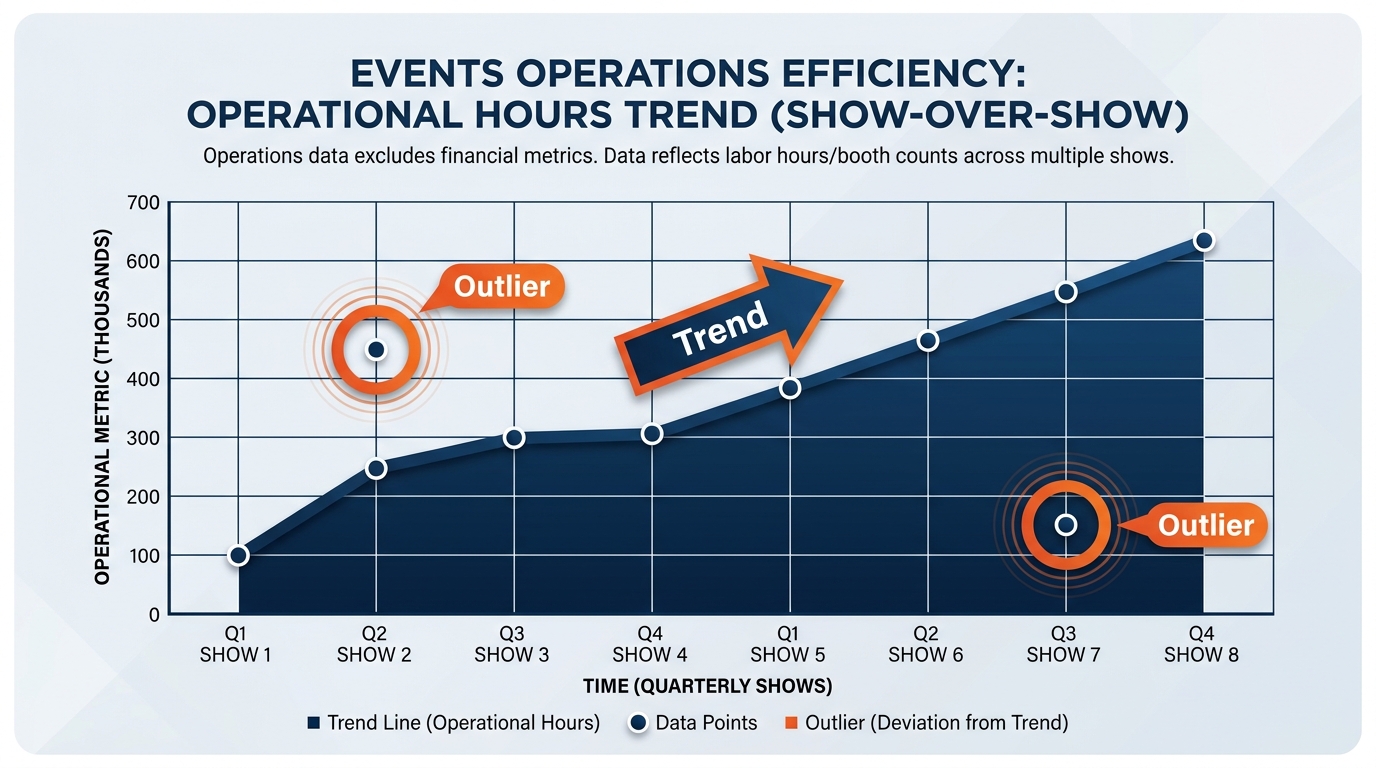
Figure 6:Trend identification and outlier detection at the question level — not the chart level. Copilot surfaces patterns you did not know to look for, in datasets too large for manual inspection.
Trend identification:
Ask Copilot to identify trends in your dataset — not just “show me this as a chart” but the analytical synthesis that goes one step further:
“Are there any consistent trends in I&D labor cost per net square foot across venues over the last six shows at each venue?”
Copilot analyzes the temporal dimension of your data, identifies directional patterns, and returns a text synthesis alongside a supporting chart. It might find: “Three venues have shown rising labor cost per net square foot in each of the last six shows. Two venues have shown declining cost per square foot over the same period, driven primarily by a lower overtime share of total hours.”
That synthesis — which would have required an analyst to manually examine dozens of data points across multiple venues and construct a narrative — arrives in seconds.
Other trend questions worth running on a recurring basis:
“Is our service attach rate rising or falling across shows at the same venue over the past three years?”
“Has the ratio of advance warehouse tonnage to direct-to-show-floor tonnage shifted over the last eight shows?”
“Is overtime as a share of total I&D hours trending in any consistent direction by jurisdiction?”
“Are onPeak room block pickup curves getting later — is the booking window compressing show over show?”
That last one is a genuinely strategic question. If the booking window is compressing across the portfolio, that changes how blocks should be sized and when attrition should be negotiated. It is exactly the kind of pattern that is invisible in any single show’s data and obvious across thirty.
Outlier detection:
Ask Copilot to find what does not fit:
“Are there any shipments in this freight file that look unusual compared to the typical patterns in the data?”
Copilot applies statistical analysis to the dataset — looking for values that deviate significantly from the distribution, timing patterns that are anomalous, or combinations of attributes that appear rarely — and surfaces the findings for your review.
In a labor context: “Which crew calls have hours per person significantly higher than others in the same jurisdiction and the same move-in phase?” Copilot identifies the statistical outliers within each jurisdiction, rather than just showing you the overall highest hour totals — which matters, because a high total in a high-rate jurisdiction may be entirely normal.
In a drayage context: “Are there any shows where material handling charge per hundredweight is unusually high or low relative to the rest of the portfolio?” Copilot finds the statistical extremes and flags them.
In a housing context: “Are there any hotel blocks where the pickup curve is meaningfully different from the pattern across the rest of the blocks for this show?”
The critical professional discipline:
Here is what Copilot’s outlier detection is not: it is not an audit. It is not a billing dispute resolution system. It is not proof of anything. It is a pattern-recognition starting point — a first pass that surfaces candidates for human investigation, not conclusions.
A shipment that Copilot flags as a statistical outlier may be:
A legitimate oversized machinery crate at a heavy-equipment show where 12,000-pound pieces are routine
A properly documented special handling charge for an uncrated or loose-load shipment
A correctly applied overtime rate for a jurisdiction where the straight-time window ends at 3:30pm
A rebill or adjustment entry that looks unusual but is fully reconciled
An actual keying error or misapplied rate that warrants investigation and possibly a credit
The professional’s job is to investigate the flag, not to act on it. Copilot found the needle candidates in the haystack. You decide which ones are actually needles.
The GES analytical questions worth asking regularly:
Table 2:High-Value Analytical Questions for GES Professionals
Function | Sample Copilot Question | Output Type |
|---|---|---|
Drayage & Material Handling | “Which shows have shown rising material handling cost per hundredweight for three or more consecutive editions?” | Trend summary + line chart |
Freight Oversight | “Are there any shows where actual freight cost exceeded the freight target by more than 20 percent?” | Flagged table + text summary |
I&D Labor Control | “Which jurisdictions have the highest overtime share of total crew hours? Rank them.” | Sorted summary table |
Post-Show Reconciliation | “Which shows closed with a reconciled margin more than 5 points below the pre-show estimate?” | Pivot Table + variance analysis |
Exhibitor Revenue | “Has service attach rate changed significantly at any recurring show over the last three editions?” | Pivot Table + trend chart |
Venue Benchmarking | “Which venues are above portfolio average on cost per net square foot but below average on margin?” | Sorted summary table |
onPeak Housing | “Show the top 10 hotel blocks by attrition exposure. Do any have pickup curves that look unusual?” | Highlighted rows + analysis note |
Advance Warehouse | “Are there any shows where advance warehouse receiving volume spiked unusually in the final week before the deadline?” | Trend summary + flagged rows |
ESG Reporting | “Has emissions per net square foot changed meaningfully at our five highest-volume venues year over year?” | Pivot Table + trend chart |
1.66. Importing Data — Copilot as Your Data Onboarding Assistant
One of the less-discussed but genuinely useful Copilot-in-Excel capabilities is assistance with data import. Copilot can help you bring data into Excel from external sources — including web pages, files in your OneDrive or SharePoint, and information from your organization’s Microsoft 365 communications.
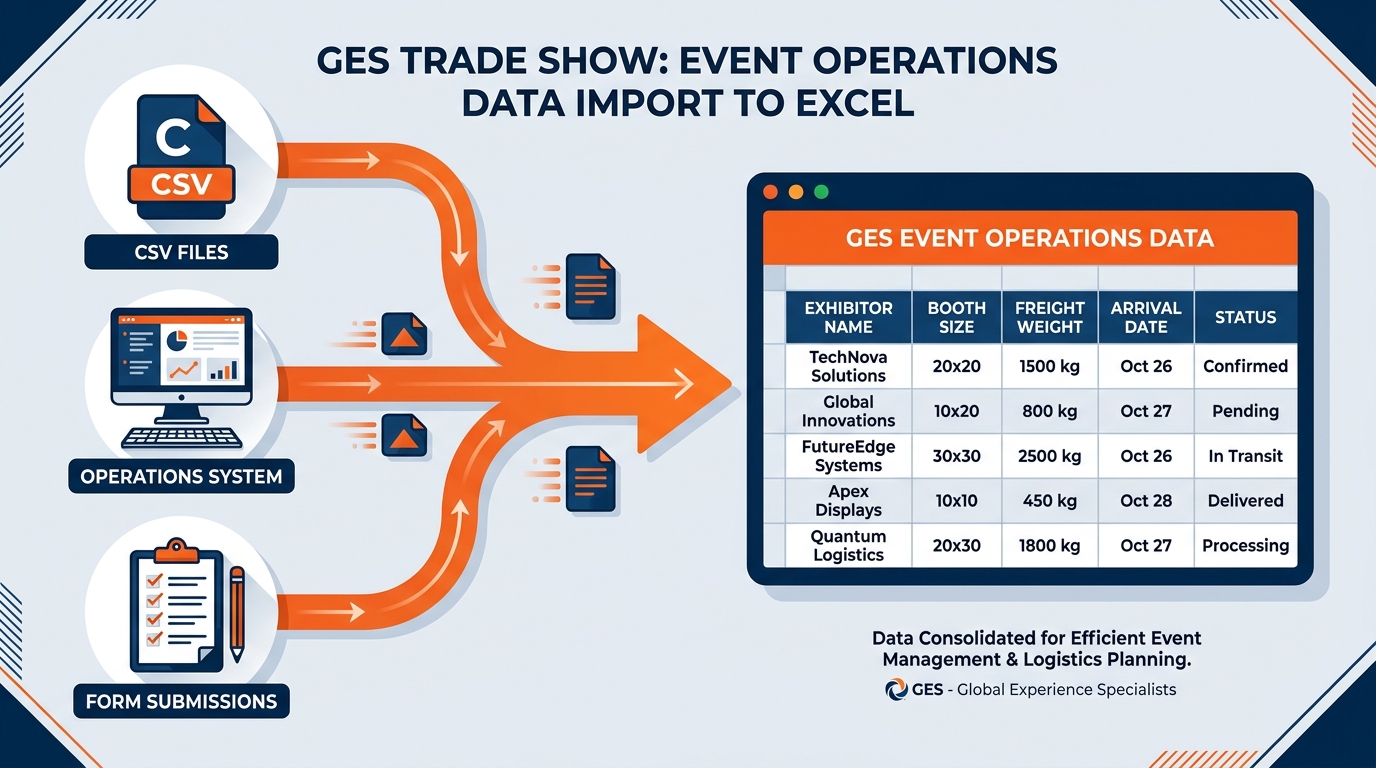
Figure 7:Copilot’s data import capability brings external data into your Excel workbook without requiring manual copy-paste or complex Power Query configurations — a meaningful time-saver for the data-pull step that precedes every analysis.
Importing from web sources:
You can ask Copilot to pull publicly available data from the web directly into your workbook. For GES professionals, this is most useful for reference data: published venue specifications, convention center exhibit hall square footage, published show dates and attendance figures, currency exchange reference rates for international shows, or publicly available industry benchmark data that you want to combine with internal performance figures.
Example: “Import the published exhibit hall square footage and dock count for the following five convention centers into this workbook.”
Copilot attempts to locate the data, import it into a new sheet or table, and link it in a way that can be refreshed. As with all web-sourced data, you should verify the source and accuracy before incorporating it into analytical outputs. And note the rule from Section 2: published venue specifications are fair game for web import. Published rates are not — those come from the tariff, not from a search result.
Importing from OneDrive and SharePoint:
Copilot can help you pull data from other files in your Microsoft 365 environment — a related workbook, a SharePoint list, or a file a colleague has shared with you. This is particularly useful when building consolidated reports that draw from multiple sources: the freight manifest from logistics, the labor call sheet from operations, the order extract from exhibitor services, and the housing pickup report from onPeak all live in different places and belong in one reconciliation.
Importing from organizational communications:
Copilot can also bring in data from your organization’s Microsoft 365 communications — for example, extracting specific figures mentioned in emails or Teams messages into your spreadsheet for tracking. This is a narrower use case but a genuinely useful one for professionals who receive regular data updates by email — daily move-in progress counts from a general foreman, weekly pickup updates from a hotel partner, running exhibitor order totals from a show team — and want to bring that data into a running workbook without manual re-entry.
Anyone who has ever maintained a show tracker by copying numbers out of forty-three separate emails understands exactly how much time this returns.
1.77. Copilot Cowork — When Excel Work Spans More Than One File
Everything to this point has described Copilot working inside a workbook you have open. That is the right model for most analysis. But a meaningful share of GES analytical work does not fit inside one workbook — and this is where Microsoft 365 Copilot Cowork changes the shape of the problem.
Cowork became generally available worldwide on June 16, 2026, after debuting in Microsoft’s Frontier early-access program in March 2026. It was the fastest-growing feature in the history of that program, and at general availability it was in use at more than half of the Fortune 500. The distinction that matters for this chapter is simple:
Table 3:Chat vs. Cowork vs. Agents — Which One for Which Job
Copilot Chat / Copilot in Excel | Cowork | Agents | |
|---|---|---|---|
Best for | Conversational analysis inside the file you have open | Delegating long-running, multi-step, multi-file work | Ready-made helpers for a narrow, repeatable task |
How you interact | A conversation — you steer each step from prompt to response | An assignment — you describe the outcome and check in at milestones | A workflow — you run the same scoped job on demand |
Typical pattern | You’re in the loop — one prompt, one result, you decide what’s next | You step away — Cowork plans, works across files and apps, delivers finished artifacts | You run it on demand — same task, same shape, every time |
GES example | “Add a freight variance column to this show file and chart it.” | “Compare drayage cost across our 12 largest shows in 5 venues and build me a labeled workbook.” | A recurring weekly pickup-report formatter |
Cowork can build workbooks from scratch. Not just edit the one you have open — create an Excel file, with multiple labeled tabs, populated with analysis it assembled by reading across many source files. Microsoft’s own flagship demonstration of this pattern produces “an Excel workbook with labeled tabs” as one of three deliverables from a single research assignment.
The GES scenario:
Imagine the request that lands on a logistics analyst’s desk in the second week of January: leadership wants to understand drayage cost variation across our twelve largest shows, spanning five venues, for the past two years — and they want it before the quarterly business review on Thursday.
The old shape of that task: pull twelve post-show reconciliation files from twelve different SharePoint folders, normalize twelve slightly different column layouts, build a consolidated table, join venue and jurisdiction attributes, calculate cost per hundredweight and cost per net square foot, split advance warehouse from direct shipments, build the comparison views, and assemble it into something presentable. Two to three days of work, most of it mechanical.
The Cowork shape of that task is a single well-scoped assignment:
Outcome: An Excel workbook comparing drayage and material handling cost across our twelve largest shows for the last two years.
Inputs: The post-show reconciliation files in the SharePoint folder Show Reconciliation FY25–FY26, and the venue reference table in Ops Reference Data.xlsx.
Definition of done: One workbook saved to my OneDrive with these labeled tabs — Summary, Cost per CWT by Show, Cost per Net Sq Ft by Venue, Advance Warehouse vs. Direct Split, Year-over-Year Variance, and Source Notes listing every file used and the date pulled.
Constraints: Use only the rates present in the source files — do not infer, estimate, or supply any rate not found in the data. Flag any show where a required field is missing rather than filling a gap. Keep the Summary tab to one screen.
Approval scope: Ask me before sharing the workbook with anyone or sending any email.
That is the whole skill. Not a prompt — an assignment, structured in the five parts Microsoft recommends: outcome, inputs, definition of done, constraints, and approval scope.
Why the “laptop off” property matters at GES more than almost anywhere:
Cowork runs in a hosted, sandboxed cloud environment. Tasks keep running when your laptop is closed. For a desk-based company that is a convenience. For GES it is the entire point.
A show operations manager at move-in does not have a two-hour block to babysit an analysis. They have a walkthrough at 8, a dock meeting at 10, a labor call at noon, and an organizer check-in at 3. What they do have is ninety seconds between meetings to describe an outcome, and eleven minutes at the end of the day to review a finished artifact. That is a fundamentally different working rhythm, and it is the one Cowork was built for. As Microsoft puts it: “It is easy to have a dozen tasks in flight at once, each one moving forward while you focus on what only you can do.”
Other GES assignments that fit the Cowork shape:
Post-show reconciliation package. “Reconcile the freight manifest, labor actuals, and exhibitor order extract for this show; produce a workbook with a margin bridge from pre-show estimate to final, a Word summary for the account manager, and a draft email to the organizer — hold the email for my review.”
Portfolio labor benchmarking. “Across every show we produced in this jurisdiction in the last 18 months, build a workbook comparing forecast to actual I&D hours, overtime share, and cost per net square foot, with one tab per venue.”
Housing block review. “For every active onPeak block, build a workbook showing pickup percentage, days to attrition deadline, and dollar exposure, with an exceptions tab for anything under 60 percent pickup inside 30 days.”
ESG data assembly. “Pull emissions and waste-diversion figures from the show reports in this library and build a workbook normalized per net square foot and per exhibitor, with a tab per region.”
Show-over-show revenue comparison. “For every show that ran in both years, compare total revenue, revenue per exhibitor, and attach rate; produce a workbook and a one-page summary of the five largest movers in each direction.”
The governance that comes with it:
Cowork asks permission before sensitive actions — sending an email, posting in Teams, updating a record. You can approve once, approve for similar actions for the rest of the session, scope approval to a specific recipient or domain, approve everything pending at once, or cancel. Medium- and high-risk actions carry a risk indicator. Every task runs with your permissions and sees only what you can see. Data stays in the tenant, existing permissions are respected, and actions are auditable.
Microsoft’s own guidance is worth quoting plainly: always review details before approving — check recipients, content, and other details. People remain responsible for business decisions. That sentence is not a legal disclaimer. It is the operating model.
A note on cost: Cowork requires the Microsoft 365 Copilot user subscription license as a prerequisite, and Cowork itself bills on usage, denominated in Copilot Credits. Task cost is driven by four inputs — model use, context retrieval, tool calls, and runtime — and tasks fall roughly into light, medium, and heavy patterns. A twelve-show, five-venue, two-year multi-file drayage comparison is a heavy task. It is also a task that used to cost two analyst-days. Judge the economics on that comparison, not in isolation.
1.88. The Verification Discipline — Why Human Review Is Non-Negotiable
We have now covered seven categories of Copilot capability. Every one of them is real, confirmed, and genuinely useful. And every one of them requires the same professional discipline: you verify what it produces before you rely on it.
This is not a caveat to be skimmed past. It is the central professional skill of effective AI-assisted analysis.
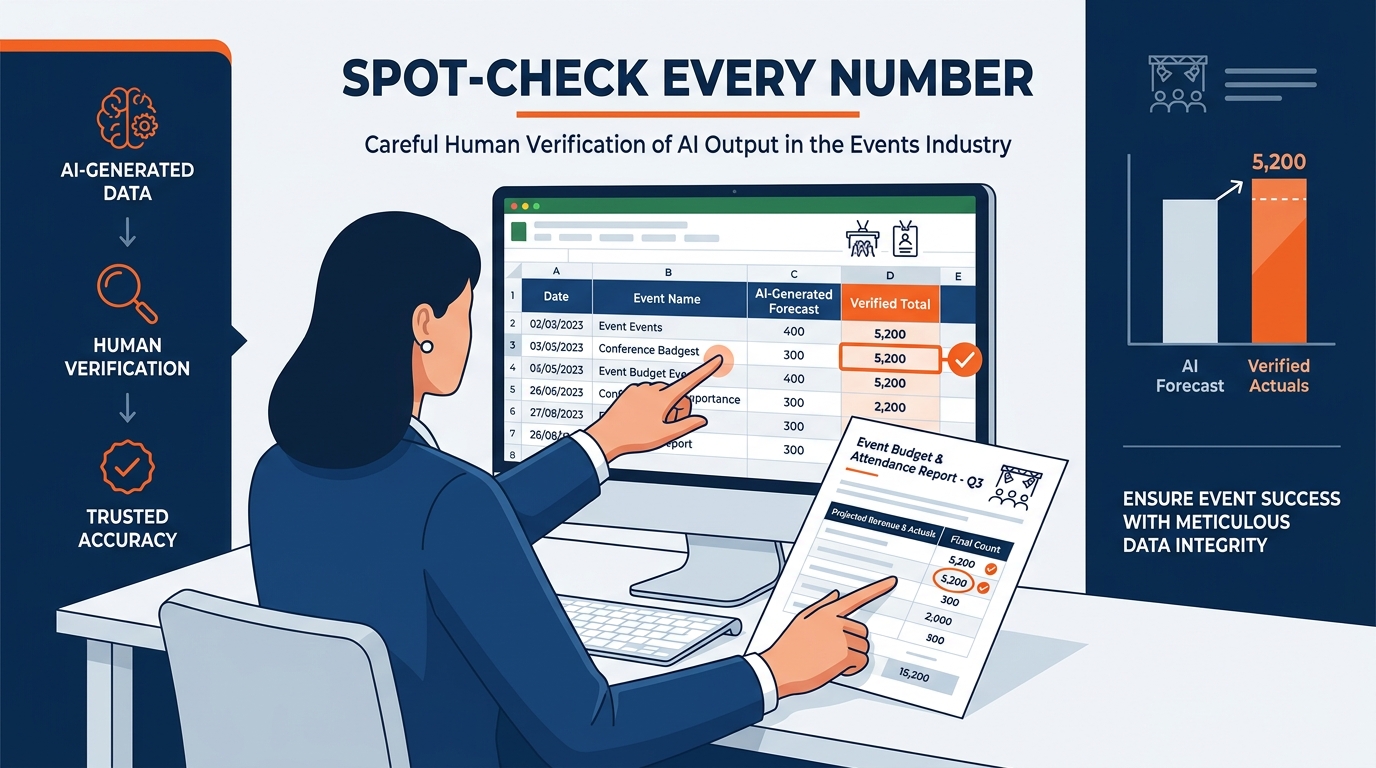
Figure 8:The verification discipline is not optional overhead — it is the professional skill that separates effective AI-assisted analysis from AI-dependent analysis. Copilot does the mechanical work. You own the results.
Why verification is especially critical in the exhibition business:
In many professional contexts, an AI error costs you embarrassment and a correction. In our business, an analytical error travels fast and lands on a customer. A miscalculated drayage estimate becomes an exhibitor invoice dispute on the show floor, in front of the client, during move-in — the least recoverable moment in the entire show cycle. A labor forecast built on a wrong overtime assumption becomes a crew that is either short-handed at the worst possible time or over-called at real cost. A margin figure that misstates a show’s performance becomes a settlement conversation with an organizer that damages a relationship we may have held for decades.
There is no outside authority waiting to catch these before the customer does. That is precisely why the discipline has to be internal.
What Copilot gets wrong in Excel:
Copilot in Excel is powerful, but it is not infallible. Here are the specific failure modes GES professionals need to watch for:
The verification protocol:
Table 4:Verification Steps Before Relying on Any Copilot Output
Output Type | Verification Step | Why It Matters |
|---|---|---|
Generated Formula | Spot-check against 3+ known values; read the explanation; confirm column references | Syntactically correct formulas can be logically wrong |
Any Rate-Based Calculation | Tie the rate to the published tariff, exhibitor service kit, or union agreement | A generated rate is a guess wearing the costume of a fact |
Chart or Pivot Table | Verify the underlying data range; confirm the aggregation method; check that totals tie to the reconciliation | Charts can visualize the right data in a misleading way |
Trend Summary | Confirm the period and phase scope; check the specific data points cited; validate against a manual sample | Copilot synthesizes from what it sees; incomplete data produces incomplete analysis |
Outlier Flag | Investigate each flag individually; do not act on a flag without understanding it | Statistical outliers are candidates for investigation, not conclusions |
Imported Data | Verify the source; check freshness; cross-reference against the authoritative system | Web and external data can be stale, incomplete, or unreliable |
Cowork Workbook | Tie at least one figure per tab to a source document; read the Source Notes tab | Multi-file work builds on assumptions you did not watch it make |
Cross-Border Data | Confirm units and currency are normalized and documented | Mixed units produce totals that are confidently wrong |
The professional framing:
A skilled analyst does not trust their own formulas without testing them. A skilled analyst does not present a chart without knowing where the data came from and what it covers. The discipline you apply to AI-assisted outputs should be the same discipline you apply to any analysis — except that AI speeds up the production, which means the verification step must become more deliberate, not less, because there is now time pressure to skip it.
Copilot is not the analyst. You are the analyst. Copilot is the tool that removed the mechanical execution barrier between your question and your answer. The professional responsibility for the answer remains entirely yours.
1.99. What Copilot in Excel Cannot Do — Knowing the Limits
Being an effective user of any tool requires knowing where the tool ends. Here is an honest accounting of what Copilot in Excel cannot do — based on its documented capabilities and confirmed limitations.
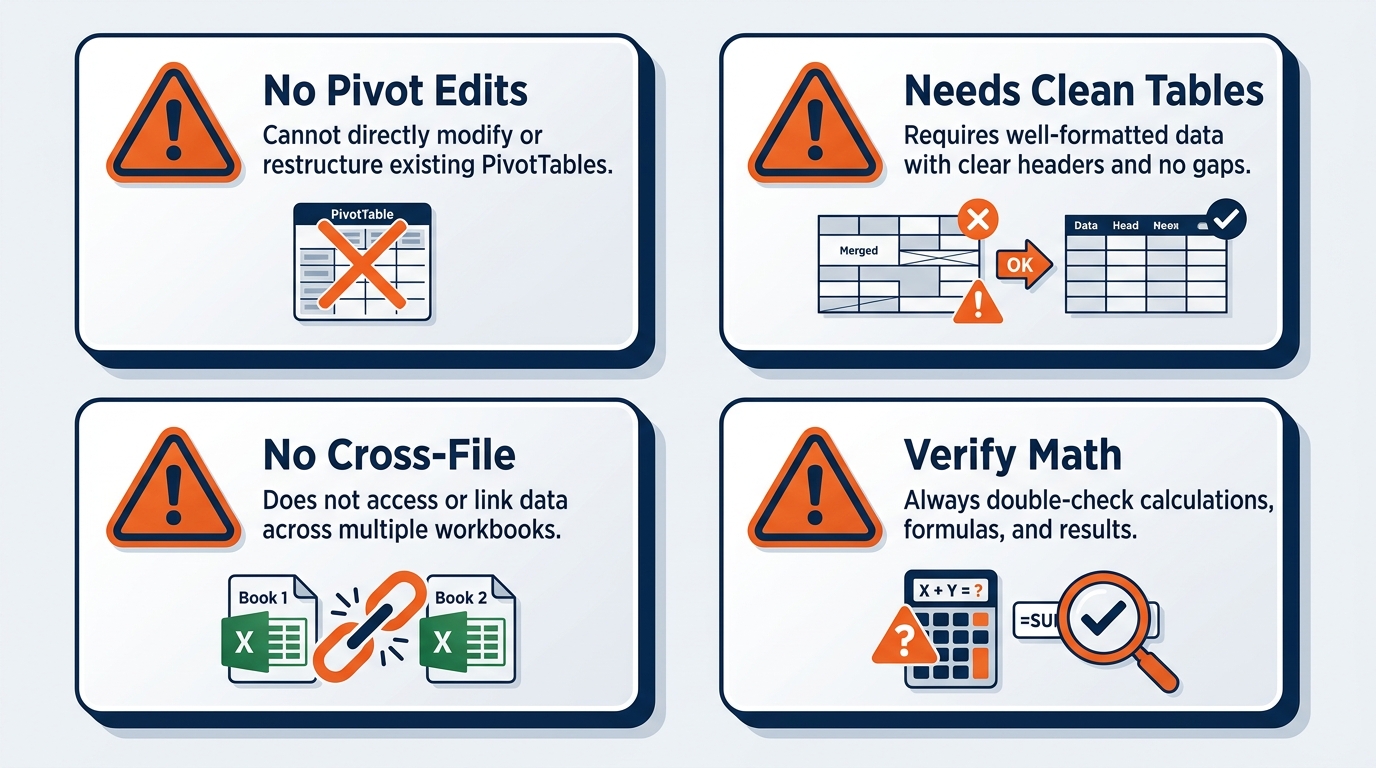
Figure 9:Knowing the limits is as important as knowing the capabilities. Effective Copilot use requires both — the confidence to use it powerfully and the professional judgment to know where human oversight is mandatory.
What Copilot cannot do:
It cannot access other workbooks automatically. Copilot in Excel works with the data in the open workbook. If your analysis requires the freight manifest, the labor actuals, and the exhibitor order extract, you need to consolidate that data manually (or via Excel’s Power Query) before Copilot-in-Excel can work with it. This is precisely the gap Cowork fills — Cowork can work across many files — but the in-app Copilot pane cannot.
It cannot supply your rates. Worth stating twice. Copilot has never seen your drayage tariff, your union agreements, your venue contracts, or this year’s exhibitor service kit. Any rate it produces is fabricated. Supply rates; do not request them.
It cannot guarantee formula correctness. Copilot generates formulas based on its understanding of your description and your table structure. If your description is ambiguous, or if your table structure is unusual, the formula may be wrong. There is no substitute for spot-checking.
It does not know your operational context. Copilot cannot know that a venue mandated a minimum crew size, that an exhibitor’s freight arrived on a carnet and cleared customs late, that a show’s move-in window was compressed because the prior tenant ran long, or that last edition’s figures were restated after a rebill. It works with the numbers in front of it. You provide the context that makes those numbers meaningful.
It cannot settle a billing dispute. Any analysis that feeds an exhibitor invoice adjustment, an organizer settlement, or a contractual claim requires human validation, documented methodology, and professional sign-off against source documents. Copilot can help build the analysis. It cannot substitute for the reconciliation.
It cannot write Python code in Excel reliably. Python in Excel is a real Microsoft feature — it allows Python code to run inside Excel cells. However, Copilot’s ability to write Python code in Excel (as opposed to formula code) is not a confirmed, generally available feature as of this writing. If you have seen this discussed online, it may be in preview for specific users or environments. Do not build workflows around this capability until you have confirmed it works in your specific GES Microsoft 365 tenant.
It does not work without a table. If you have not formatted your data as an Excel table, Copilot cannot read it. Full stop.
It cannot work offline. Copilot requires an internet connection and your Microsoft 365 credentials. It is a cloud-connected service. Show floor connectivity is famously variable — plan the analysis for the show office, not the aisle.
1.1010. What’s Coming — Announced Features to Watch
Microsoft regularly announces new Copilot capabilities before they reach general availability. As a GES professional, it is useful to know what is on the roadmap — with the clear understanding that announced features are not the same as available features, and the timing of releases frequently shifts.
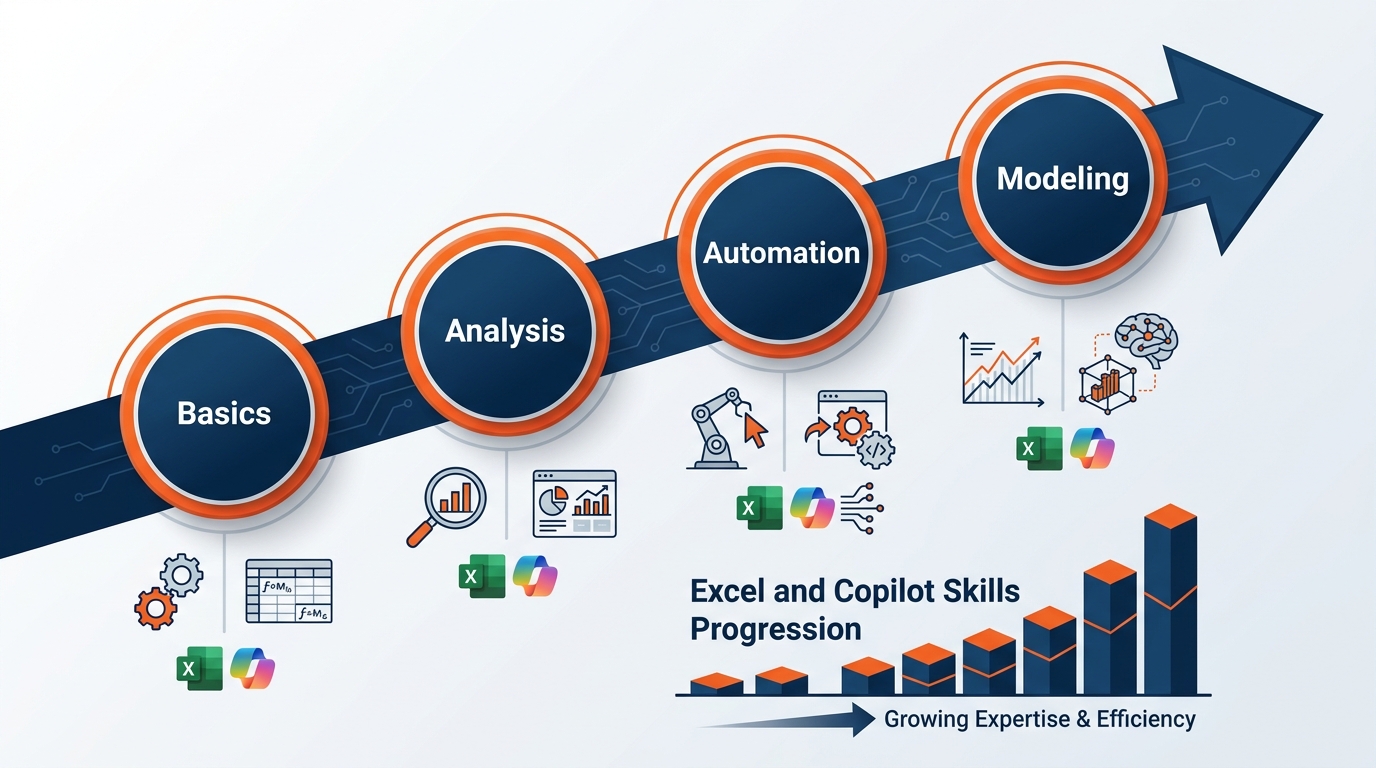
Figure 10:The Copilot in Excel capability trajectory — from its 2023 introduction through confirmed 2025–2026 features and announced capabilities that are in preview or rolling out. The dotted line represents announced but not yet generally available features.
Advanced Analysis Planning (Preview):
Microsoft has announced a capability — sometimes referred to in preview communications as “Plan Mode” or “Advanced Analysis” — in which Copilot will outline its analytical approach before executing it, giving users the ability to review and adjust the methodology prior to any changes being made to the workbook. This is a meaningful capability for professionals who need to understand and document the methodology behind a reconciliation before it becomes the basis of a settlement.
As of this writing, this feature is in preview for select users and environments — it is not yet confirmed as generally available. If you are interested in whether it has reached your GES Microsoft 365 tenant, check with your IT administrator or look for updates in Microsoft’s M365 admin center.
The underlying goal — giving professionals visibility into Copilot’s analytical methodology before it is applied — aligns directly with the documentation expectations of post-show reconciliation and ESG reporting. When it reaches general availability, it will be an important addition to the professional workflow described in this chapter.
Python integration:
Microsoft has announced deeper integration between Copilot and Python in Excel, which would allow natural-language prompts to generate Python analytical scripts running inside Excel cells. This would extend Copilot’s analytical reach to statistical modeling and custom data processing that goes beyond Excel’s native formula capabilities — forecasting labor demand from historical show characteristics, for instance, or modeling freight volume against exhibitor mix. This feature is in active development and preview; watch for Microsoft announcements on its general availability.
Cowork model evolution:
At general availability Cowork runs on Anthropic’s Opus 4.8 and Sonnet 4.6 models, with Cowork 1 — Microsoft’s own secure, fine-tuned, substantially lower-cost model — releasing shortly after. The multi-model design means capability and economics should both improve over time without a change in how you write assignments. Custom skills (up to 50) and App Store plugins are also available to extend what Cowork knows how to do — a natural future home for GES-specific analytical patterns.
For the most current feature status:
Microsoft 365 Admin Center → Message Center (for your IT administrator)
Microsoft 365 Roadmap — the official source for what is released, in preview, and planned
Your GES IT team — who receive Microsoft communications about tenant-level feature availability
1.11🧪 Try This — A Complete Copilot-in-Excel Analysis Session
This exercise takes you through the complete workflow — from properly set-up data to analyzed insight — using only confirmed Copilot capabilities. It is designed to be done with real or realistic data in your GES Microsoft 365 environment.
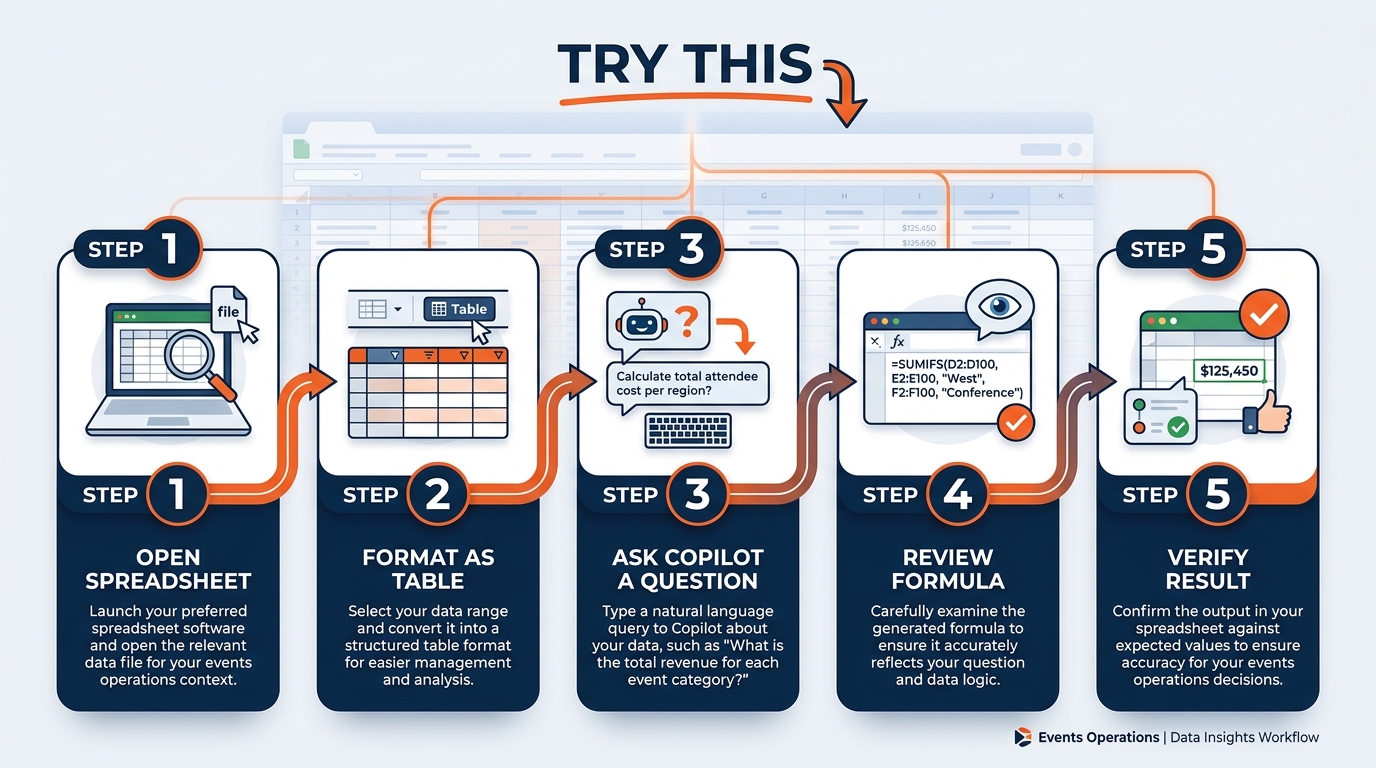
Figure 11:The six-step Copilot-in-Excel workflow — from raw data to verified analytical insight. First run: approximately 20 minutes. Repeated use: under 5 minutes once the workflow is familiar and your data is consistently structured.
1.12The Bigger Picture — What Excel Becomes
Before we close, let’s step back and look at what Copilot in Excel actually represents — not feature by feature, but as a shift in professional capability.
Excel has been the world’s most widely used data tool for four decades. Through that entire history, its fundamental interaction model remained constant: you, the professional, expressed your analytical intent by constructing formulas, building Pivot Tables, creating charts, and writing macros. The computer executed exactly what you told it to, in the language you had learned. The analytical floor — the minimum you had to know to get useful output — was relatively high.
Copilot lowers that floor dramatically. The professional knowledge required to ask a question of your data is now English fluency, not Formula fluency. The ceiling of what non-programming professionals can analyze without a data science team rises significantly. And the time between “I have this question” and “I have this answer” compresses in ways that change which questions get asked at all.
This is not a replacement of analytical professionals. It is a reallocation of their time. The same professional who was spending 60% of analytical time on mechanical execution — formula construction, table building, chart formatting — can now spend that time on interpretation, judgment, and decision-making. Which is, not coincidentally, what they were hired to do.
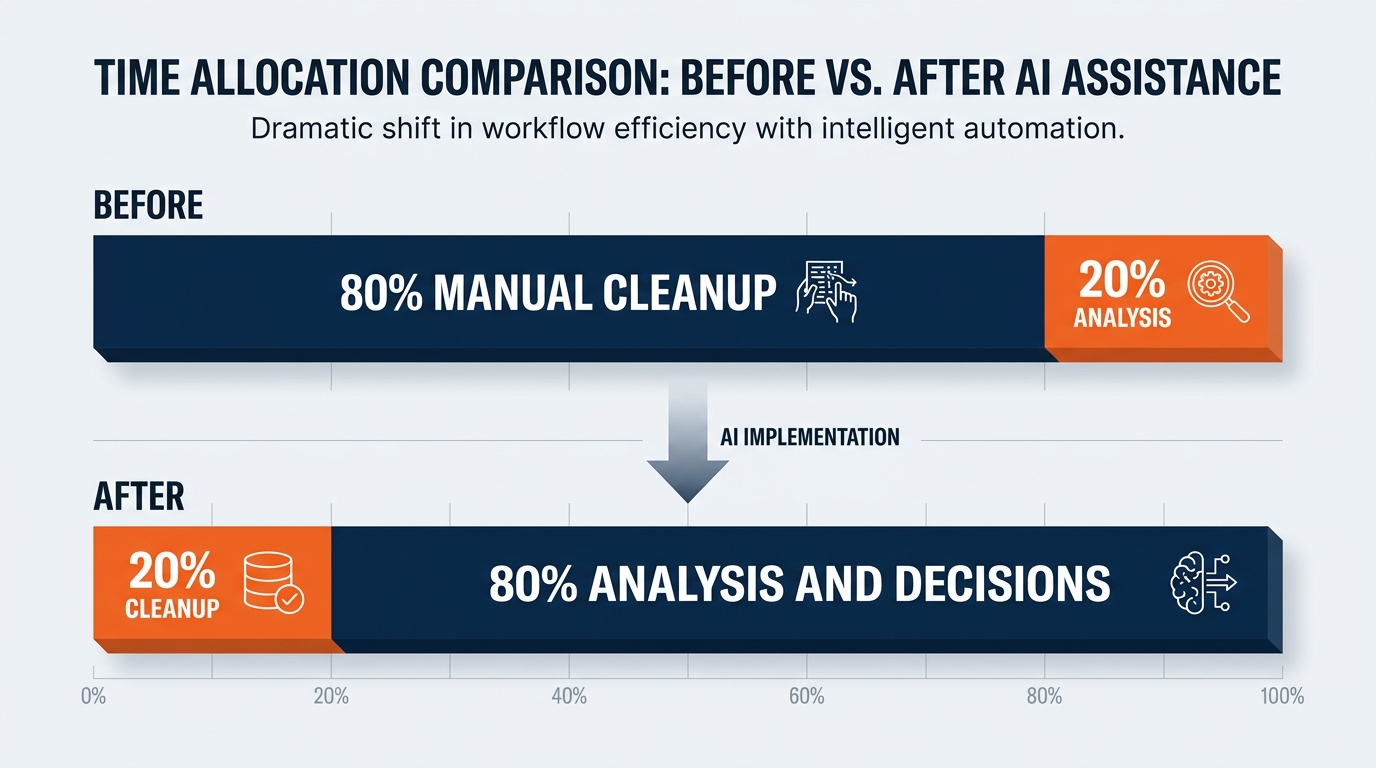
Figure 12:The fundamental reallocation that Copilot in Excel enables — not from humans to AI, but from mechanical execution to professional judgment. Same professional. Same hours. Dramatically different ratio of valuable work to mechanical work.
For GES specifically:
Every analytical professional across the GES Collective — every show operations manager tracking labor against forecast, every logistics analyst reconciling freight targets, every finance analyst closing a show P&L, every onPeak housing analyst watching pickup curves against attrition deadlines, every account manager preparing a post-show recap for an organizer, every Spiro producer managing a build budget, every SHOWTECH lead costing power and rigging, every Visit by GES product analyst reading lead-capture data — can do more, faster, with better documentation of how they got there.
And there is a moment behind this that is worth naming. On December 31, 2024, GES completed its separation from Viad and became an independent company under Truelink Capital for the first time in 55 years. Independence means the roadmap is ours. It also means the standard is ours — nobody else sets it, nobody else enforces it, and nobody else gets the credit when the numbers are right.
We are not new to this. The onPeak AI Smart Suite already puts AI-powered hotel search, contract reading, and email categorization into production. Data-led ESG emissions reporting is already an analytics-first program. Excel with Copilot is not a departure from what GES is doing. It is the same transformation arriving on the desktop of every person who opens a spreadsheet.
The competitive dimension is real. In a business where we compete on execution — where the difference between a good show and a great one is measured in hours saved on the dock and errors caught before they reached the exhibitor — organizations that build genuine fluency in AI-assisted analytics will simply answer harder questions faster, with more consistent quality, and with more capacity left over for the human work that actually wins renewals.
But the competitive dimension starts with a single professional, on a single show file, asking a question they would not have had time to ask before. That is what this session has been building toward.
Start with one show file. Format it as a table. Open Copilot. Ask it something.
See what it shows you.
Excel Table A structured data range in Microsoft Excel with defined headers, formatted via Insert → Table or Ctrl + T — the required data format for Copilot in Excel to read and analyze your data.
Formula Generation Copilot’s ability to create syntactically correct Excel formulas from plain-English descriptions, including complex functions such as XLOOKUP, SUMIFS, nested IFs, and statistical calculations.
Formula Explanation Copilot’s ability to read an existing Excel formula and explain what it does in plain English — useful for understanding inherited reconciliation models or auditing complex calculations.
Natural-Language Data Exploration The Copilot capability that allows professionals to ask business questions of their Excel data in plain English and receive answers as charts, Pivot Tables, text summaries, or highlighted ranges.
Trend Identification Copilot’s analytical capability to detect directional patterns across a temporal dataset — identifying which metrics are consistently rising, falling, or exhibiting change-of-direction signals across shows, venues, or editions.
Outlier Detection Copilot’s statistical capability to surface data points that deviate significantly from the patterns in a dataset — candidates for human investigation, not automatic conclusions.
Verification Discipline The professional practice of checking every Copilot output — formulas, charts, Pivot Tables, analytical summaries — against known values, source documents, or published tariffs before relying on it for decision-making or reporting.
Rate Sheet Rule The GES discipline that Copilot may perform arithmetic on rates but must never be asked to supply them. Drayage tariffs, union hourly rates, and venue charges come from the published rate sheet, exhibitor service kit, or labor agreement — never from a generated answer.
Copilot Cowork Microsoft 365 Copilot’s delegated-work experience, generally available June 16, 2026. Executes long-running, multi-step, multi-file tasks in a hosted cloud environment and returns finished artifacts — including Excel workbooks with labeled tabs created from scratch — while your device is off.
Drayage The movement of exhibitor freight from the dock or advance warehouse to the booth space on the show floor, and back out at move-out. Billed by weight, typically per hundredweight, under a published tariff.
Material Handling The service of receiving, storing, delivering, and removing exhibitor freight at a show. Frequently used interchangeably with drayage; a primary GES revenue line and a primary subject of Excel analysis.
Hundredweight (CWT) A freight billing unit equal to 100 pounds. Material handling rates are commonly quoted per hundredweight, subject to a minimum weight per shipment.
Advance Warehouse A GES facility that receives exhibitor freight in the weeks before a show, stores it, and delivers it to the show floor during move-in — as opposed to direct-to-show-site shipments that arrive during the move-in window.
I&D (Install & Dismantle) The labor function of building and tearing down exhibits and show infrastructure. Tracked in crew hours against forecast, split by straight time, overtime, and double time.
Union Jurisdiction The labor agreement and work rules governing a given venue or city, determining which trades may perform which tasks, applicable hourly rates, and the straight-time window — a primary driver of cost variation between otherwise identical shows.
Post-Show Reconciliation The process of closing a show financially — matching billed revenue, actual labor, freight, and third-party costs to produce a final margin and settle with the organizer and exhibitors.
Attach Rate The percentage of exhibitors at a show who purchase at least one GES service. A core commercial metric, analyzed alongside service revenue per exhibitor.
Room Block Pickup The percentage of a contracted hotel room block actually booked by attendees, managed by onPeak. Shortfalls against the contracted minimum create attrition exposure.
Attrition The contractual penalty owed when a contracted hotel room block is not filled to its committed level — the financial risk that makes pickup curve analysis a recurring onPeak workbook.
Microsoft 365 Roadmap Microsoft’s official public tracker of Microsoft 365 feature releases — showing what is available, what is in preview, and what is planned. The authoritative source for feature status questions.
OneDrive for Business Microsoft’s cloud file storage service integrated with Microsoft 365 — the required storage location (along with SharePoint) for Excel files to be accessible by Copilot in Excel.
Hallucination (in Excel context) The risk that Copilot generates a formula, a rate, or an analytical conclusion that appears correct but is wrong — a known AI limitation that makes the verification discipline mandatory rather than optional.